Winter Lagoon Sludge Reduction Case Study: 37.9% Verified by Sonar Mapping
Overview
A Central Illinois rendering facility partnered with Drylet to address sludge accumulation in a wastewater lagoon and document changes in lagoon conditions over time. A baseline sonar survey on October 20, 2025, estimated 918,524 gallons of accumulated sludge. Drylet applied BioDredger® on November 13, 2025, followed by lagoon mixing to increase contact between the treatment and accumulated solids.
Two follow-up sonar surveys documented a reduction in estimated sludge volume during the winter period and further reduction by June 2026. The final survey, completed approximately seven months after the BioDredger application, recorded 570,650 gallons of sludge, a 37.9% decrease from baseline.
Key Results
- 37.9% reduction in sonar-estimated lagoon sludge volume by June 24, 2026.
- 347,874 gallons less estimated sludge volume than the October 2025 baseline.
- 23.5% reduction recorded by March 3, 2026, approximately three and a half months after application.
- Average sludge depth decreased from 9.1 feet to 6.5 feet.
- Average water depth increased from 5.4 feet to 7.0 feet.
Facility Challenge: Sludge Accumulation and Reduced Lagoon Capacity
The rendering facility was managing an accumulated sludge layer that occupied a substantial portion of its wastewater lagoon. Drylet conducted a baseline sonar mapping survey to establish the starting conditions before biological treatment.
The October 20, 2025 survey recorded an overall lagoon depth of 14.5 feet, average sludge depth of 9.1 feet, and average water depth of 5.4 feet. Estimated sludge volume was 122,789 cubic feet, equivalent to 918,524 gallons. The average sludge layer represented nearly two-thirds of the recorded lagoon depth.
The project used repeated surveys by Drylet Sonar Mapping Service to estimate sludge volume and compare results at three dates. Related reading: Lagoon Sludge Mapping vs. Sludge Depth Measurement.
BioDredger Treatment and Verification Timeline
Drylet developed a program using its patented BioDredger® biological bioremediation technology. The treatment was applied on November 13, 2025, and the lagoon was mixed afterward to increase contact with the accumulated organic solids.
- October 20, 2025: Baseline sonar survey measured the initial lagoon profile and estimated sludge volume.
- November 13, 2025: BioDredger applied, followed by lagoon mixing.
- March 3, 2026: First verification survey evaluated changes through the winter period.
- June 24, 2026: Second verification survey documented additional change into the summer.
Winter Results: 23.5% Sludge Volume Reduction
The March 3, 2026 sonar survey estimated 702,528 gallons of sludge, compared with 918,524 gallons at baseline. This represented a 23.5% reduction over approximately three and a half months following treatment.
Average sludge depth declined from 9.1 feet to 7.5 feet, while average water depth increased from 5.4 feet to 6.0 feet. The survey recorded an overall lagoon depth of 13.5 feet.
This verification period extended through winter, when lower temperatures can influence biological treatment conditions. The original project report includes daily high and low air temperatures for Mason City, Illinois, as seasonal context. These air-temperature records are not measurements of lagoon water temperature. For further technical background, see How Cold Weather Impacts Wastewater Lagoon Performance.

June Verification: 37.9% Reduction from Baseline
A second comparison survey on June 24, 2026, estimated 570,650 gallons of sludge remaining in the lagoon. Compared with the original 918,524 gallons, the mapped sludge volume had declined by 347,874 gallons, or 37.9%.
Average sludge depth was 6.5 feet, down from 9.1 feet at baseline. Average water depth increased to 7.0 feet, a 1.6-foot increase from the initial survey. The overall lagoon depth reported for the June survey was 13.5 feet.
These measurements documented continued improvement in the mapped lagoon profile after the winter survey. They provide a quantitative record of changing sludge accumulation and water depth following treatment.
Sonar Mapping Evidence
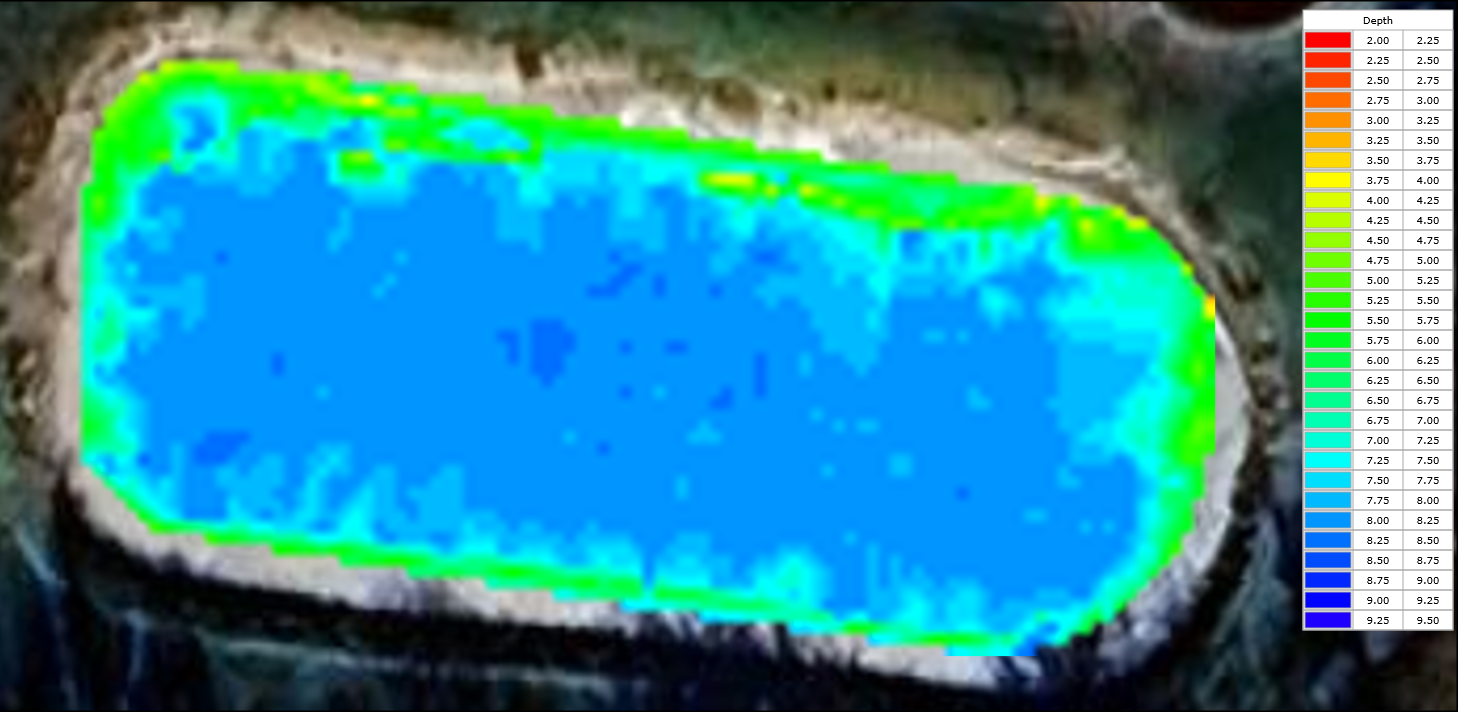
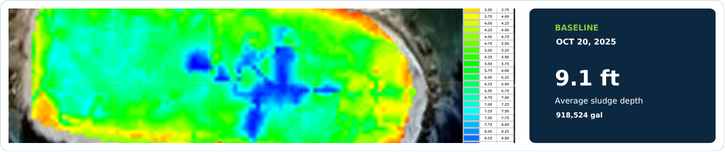
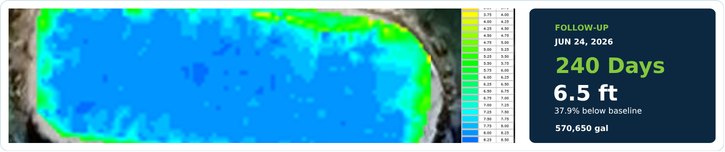
The same lagoon was surveyed on three dates. The original sonar maps provide visual comparisons of the sludge profile alongside the estimated volume measurements.
October 20, 2025: Baseline
Estimated sludge volume: 918,524 gallons. Average sludge depth: 9.1 feet.
March 3, 2026: Winter Verification
Estimated sludge volume: 702,528 gallons. Reduction from baseline: 23.5%. Average sludge depth: 7.5 feet.

June 24, 2026: Summer Verification
Estimated sludge volume: 570,650 gallons. Reduction from baseline: 37.9%. Average sludge depth: 6.5 feet.
Detailed Survey Measurements
Overall lagoon depth: 14.5 feet at baseline, 13.5 feet in March, and 13.5 feet in June.
Average water depth: 5.4 feet at baseline, 6.0 feet in March, and 7.0 feet in June.
Average sludge depth: 9.1 feet at baseline, 7.5 feet in March, and 6.5 feet in June.
Lower average sludge level: 7.9 feet at baseline, 6.2 feet in March, and 5.8 feet in June.
Upper average sludge level: 10.3 feet at baseline, 8.7 feet in March, and 7.2 feet in June.
Estimated sludge volume in cubic feet: 122,789 at baseline, 93,914 in March, and 76,285 in June.
Estimated sludge volume in gallons: 918,524 at baseline, 702,528 in March, and 570,650 in June.
Measurement note: The reported percentages are changes in sonar-estimated sludge volume. They are not direct measurements of dry-solids mass.
Project Outcome
Drylet's sonar mapping surveys documented a decrease in the lagoon's estimated sludge volume following the BioDredger application and mixing. The reduction was evident during the winter verification survey and continued through June 2026. Over the full observation period, the mapped sludge volume declined by 37.9%, while average water depth increased from 5.4 feet to 7.0 feet.
The project illustrates the value of documenting lagoon conditions at baseline and revisiting the same lagoon to measure how the sludge profile changes over time. The reported results are specific to this facility and observation period.
Download the full case study: Central Illinois Rendering Plant Winter Case Study
Explore Lagoon Sludge Reduction and Sonar Mapping
Learn about Drylet's BioDredger biological lagoon treatment and Sonar Mapping Services for evaluating sludge accumulation and monitoring changes in lagoon conditions.